

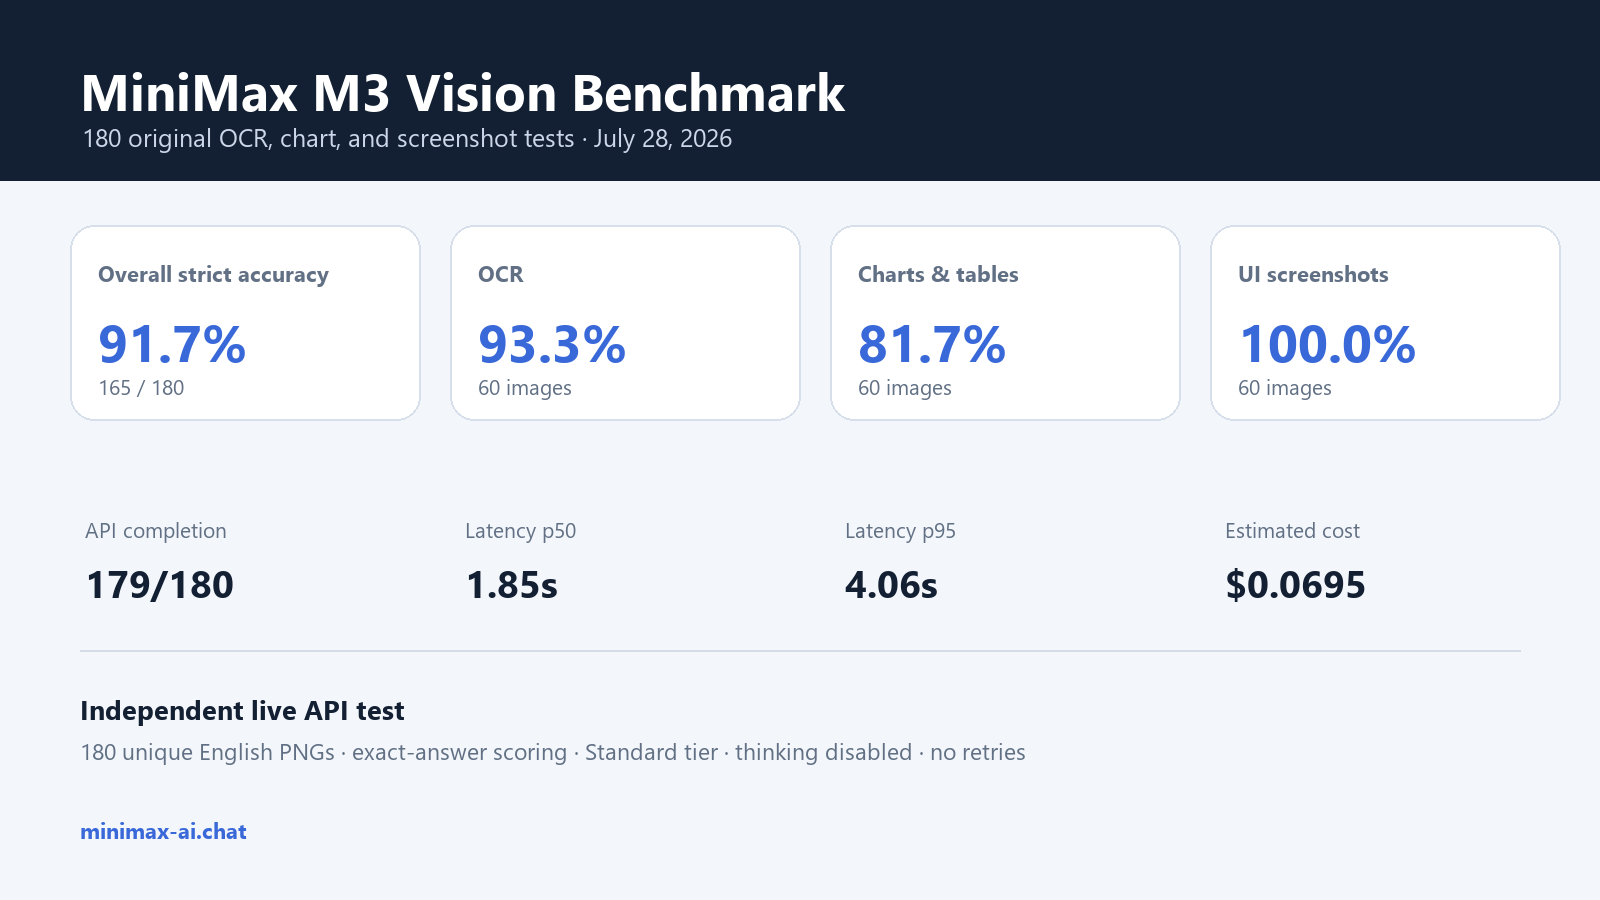
We ran a MiniMax M3 vision benchmark on 180 original English images: 60 OCR tasks, 60 chart and table questions, and 60 synthetic application screenshots. Using exact-answer scoring, MiniMax M3 passed 165/180 attempts (91.67%) end to end. The test also measured API completion, difficulty effects, negative-control behavior, latency, returned token usage, and cost.
Tested July 28, 2026. Every raster image, answer key, prompt, generator, sanitized response, and checksum in this study was created or recorded for this experiment. MiniMax-AI.chat is an independent site and is not MiniMax or an official MiniMax publication.
Bottom line: UI screenshots produced the strongest category score at 60/60 (100.00%), while charts and tables was the weakest at 49/60 (81.67%). Across all 180 calls, API completion was 179/180 (99.44%), median client-observed latency was 1.851s, and the usage-derived Standard-tier cost was $0.0695367.
MiniMax-AI.chat Editorial Team
MiniMax M3 vision benchmark at a glance
| Scored API attempts | 180 |
|---|---|
| Unique source images | 180 English PNGs at 1200×750 |
| Task families | 60 OCR, 60 charts/tables, 60 UI screenshots |
| Difficulty balance | 60 easy, 60 medium, 60 hard; 20 per family at each level |
| Strict passes | 165/180 (91.67%; 95% Wilson interval 86.71%–94.89%) |
| Completed API responses | 179/180 (99.44%) |
| Negative controls | 26/27 (96.30%) |
| Endpoint and tier | POST /v1/chat/completions, Standard tier |
| Requested / returned model | MiniMax-M3 / MiniMax-M3 |
| Reasoning and sampling | Thinking disabled; temperature 0; non-streaming; 64-token output ceiling |
| Retries | Zero; every API error remained a failed scored attempt |
| Latency p50 / p95 | 1.851s / 4.059s |
| Usage-derived cost | $0.0695367 |
What this benchmark tests—and what it does not
This is an image-understanding test. We supplied MiniMax M3 with a raster image and one objective question, then scored the returned text against a value fixed before the run. It is separate from our MiniMax Image-01 English text benchmark, which tested whether an image-generation model could create readable text inside new images. Here, M3 had to read and interpret images that already existed.
- OCR: invoices, serials, contact cards, schedules, rotated labels, configuration panels, replacement codes, and deliberately absent fields.
- Charts and tables: bars, lines, grids, donuts, scatter plots, direct lookups, extrema, rank, differences, row sums, and absent categories.
- UI screenshots: metrics, selected navigation, statuses, validation errors, mobile tabs, toasts, form values, progress, destructive actions, badges, and missing controls.
The experiment did not test photographs, handwriting, video, multilingual OCR, click coordinates, accessibility trees, or competing models. It is a bounded visual-question-answering benchmark, not a general claim about every M3 vision workload.
How we built 180 original visual tasks
We generated all 180 images locally from a deterministic English fixture set. Names, codes, invoices, charts, products, dates, messages, and interface states are fictional. No source page, DOM, CSV, answer metadata, or alt text was sent to the model—only the final PNG and the question.
Each category contains 20 easy, 20 medium, and 20 hard cases. Easy images use larger, high-contrast text and lower density. Medium cases add more distractors and smaller type. Hard cases use still-readable small text, denser layouts, mild blur/noise, or a slight rotation. These difficulty labels describe the generator settings; they are not provider-defined tiers.
We also included 27 preregistered negative controls—nine in each category. Those questions asked for a field, chart category, point, file, button, or UI state that was intentionally absent. The required answer was NOT PRESENT. This measures false-positive behavior rather than rewarding a model for always extracting nearby text.
API configuration and run protocol
MiniMax’s current M3-specific Chat Completions reference documents image input through an image_url content item using either a remote URL or a Base64 data URL. We used one Base64 PNG per request at detail: default. The official schema permits PNG, JPEG, GIF, and WebP images up to 10 MB each; every file in this benchmark was below that limit.
{
  "model": "MiniMax-M3",
  "service_tier": "standard",
  "thinking": { "type": "disabled" },
  "temperature": 0,
  "max_completion_tokens": 64,
  "stream": false,
  "messages": [{
    "role": "user",
    "content": [
      { "type": "text", "text": "Inspect the image... Reply with only the answer." },
      { "type": "image_url", "image_url": { "url": "data:image/png;base64,...", "detail": "default" } }
    ]
  }]
}
The request order was fixed by a seeded SHA-256 sort before the first live call. We sent requests sequentially at concurrency one. Thinking was explicitly disabled because M3 otherwise defaults to adaptive thinking; this keeps the page focused on vision input rather than comparing reasoning modes. We did not retry content mistakes, timeouts, or HTTP failures, and we did not use an LLM judge.
Overall accuracy and confidence interval
MiniMax M3 produced 165 strict passes from 180 attempts: 91.67%. The 95% Wilson interval is 86.71%–94.89%. Normalized scoring—which lowercased answers and standardized Unicode dash variants while still rejecting explanations—passed 165/180 (91.67%). The 0 formatting-only differences between those scores received no credit in the headline result.
| Task family | Strict passes | Accuracy | Latency p50 | Latency p95 | Estimated cost |
|---|---|---|---|---|---|
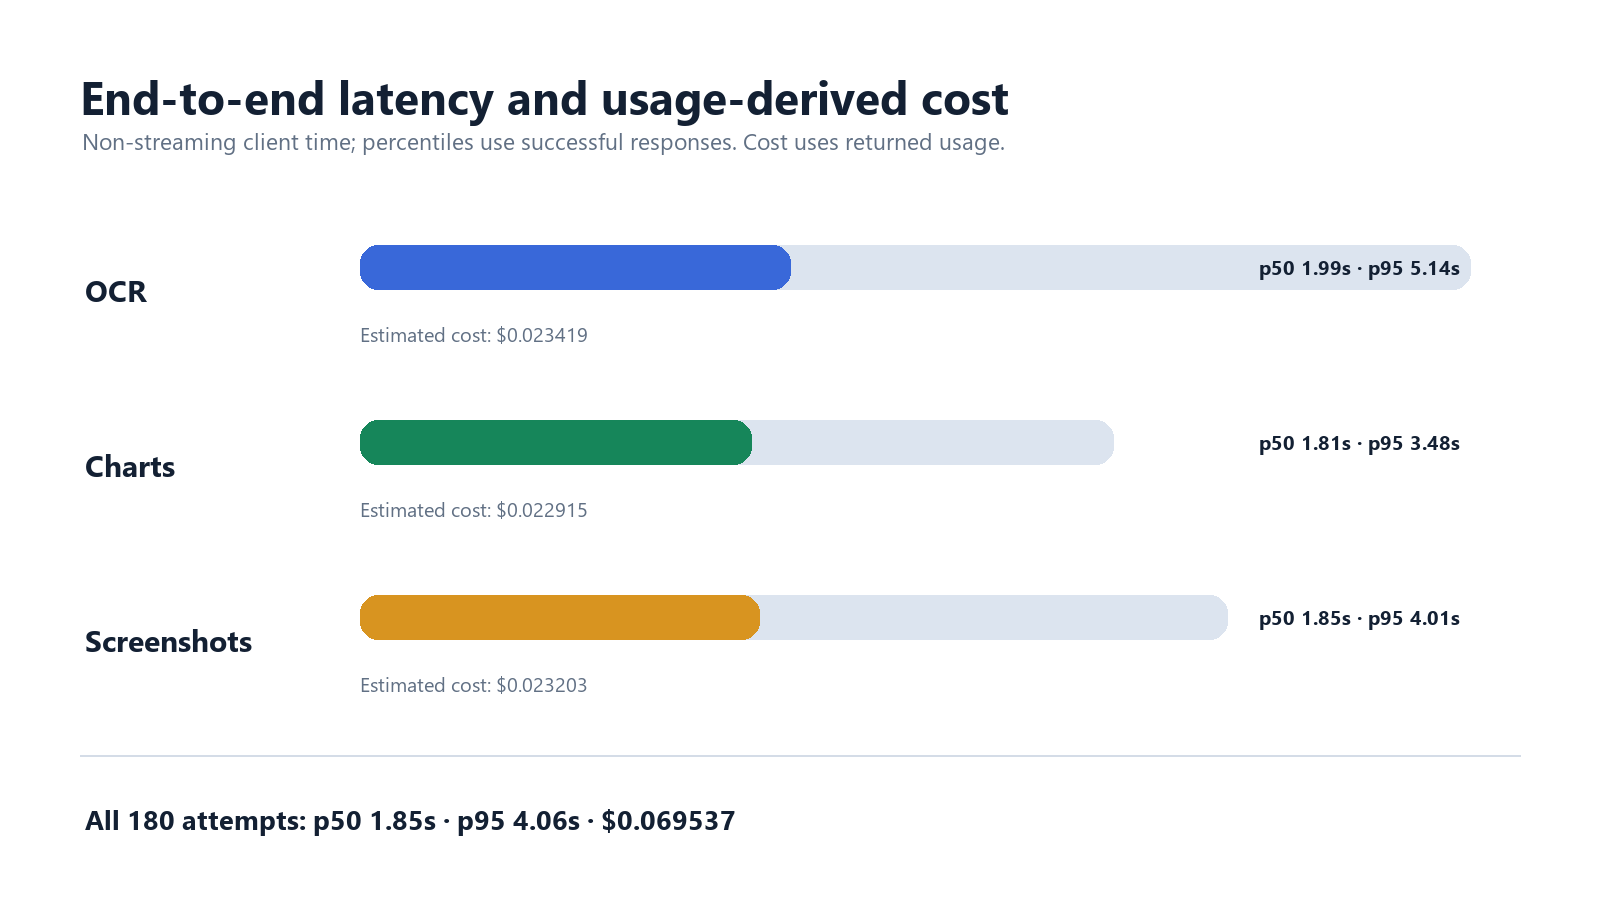
| OCR | 56/60 | 93.33% | 1.990s | 5.138s | $0.023419 |
| Charts and tables | 49/60 | 81.67% | 1.808s | 3.484s | $0.022915 |
| UI screenshots | 60/60 | 100.00% | 1.849s | 4.011s | $0.023203 |
The category gap is descriptive, not proof that one visual task type is universally easier. The fixtures differ in information density and required operation. Still, the split is operationally useful: it shows where this exact configuration was more dependable and where developers should add deterministic validation or review.
Accuracy by difficulty
| Family | Easy | Medium | Hard | All |
|---|---|---|---|---|
| OCR | 20/20 (100.0%) | 18/20 (90.0%) | 18/20 (90.0%) | 56/60 (93.3%) |
| Charts and tables | 20/20 (100.0%) | 17/20 (85.0%) | 12/20 (60.0%) | 49/60 (81.7%) |
| UI screenshots | 20/20 (100.0%) | 20/20 (100.0%) | 20/20 (100.0%) | 60/60 (100.0%) |
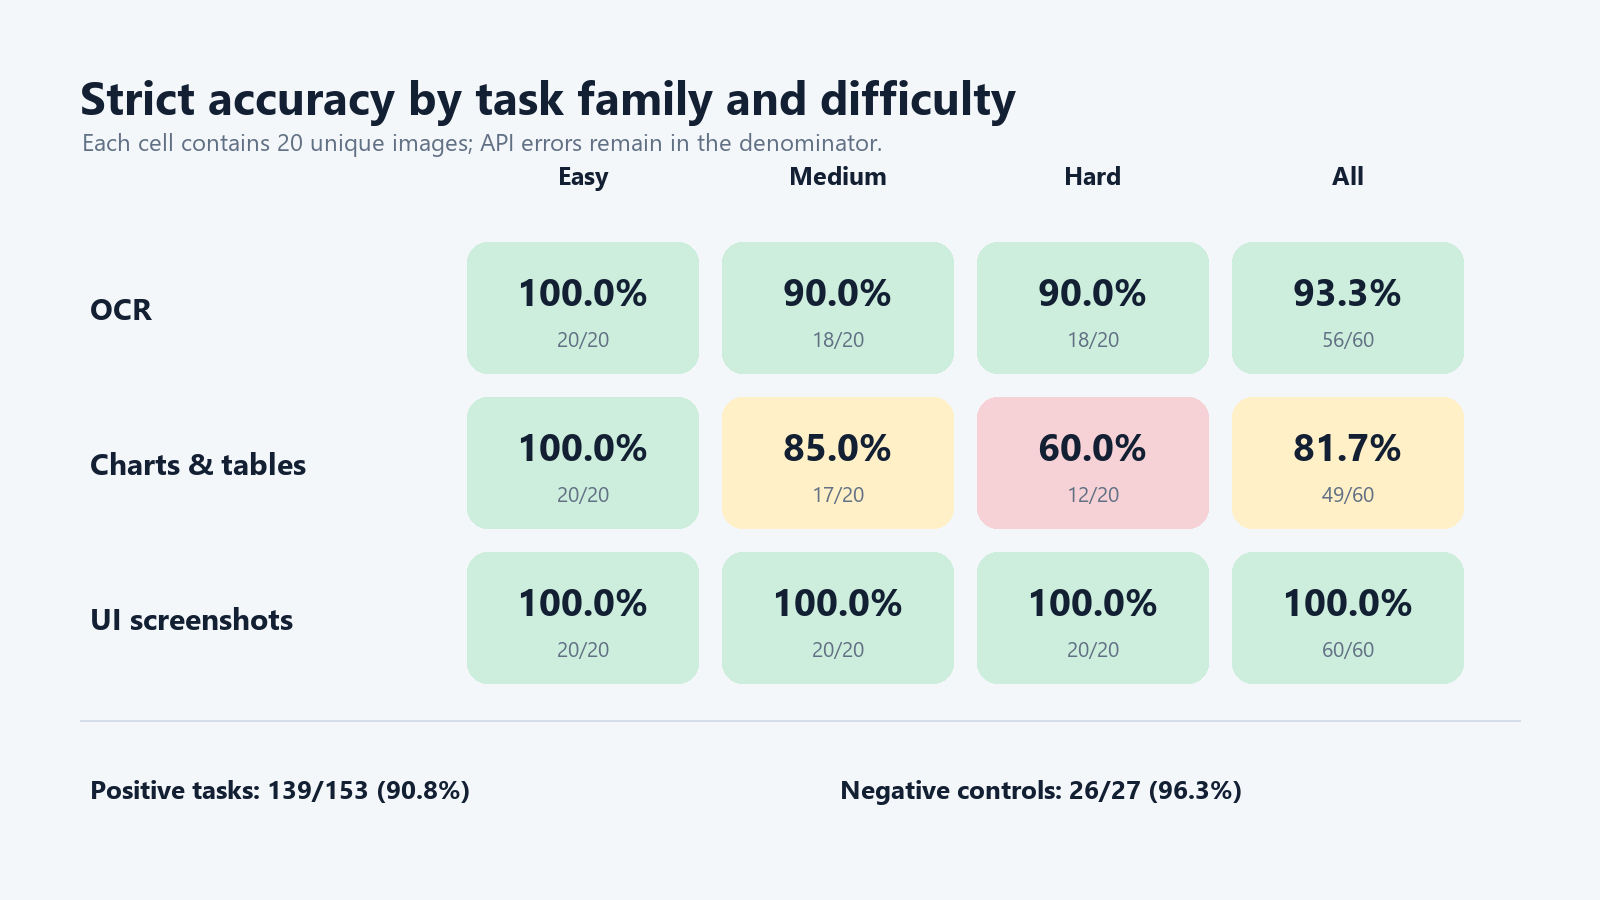
Across categories, easy cases passed 60/60 (100.00%), medium cases passed 55/60 (91.67%), and hard cases passed 50/60 (83.33%). This pattern is an association inside the synthetic test set. It does not isolate which individual property—font size, density, blur, or rotation—caused a particular error.
OCR results
The OCR family scored 56/60 (93.33%). On completed positive OCR tasks, character error rate was 0.58%. That secondary measure counts edit distance across the requested answer strings; the primary metric still requires the entire response to match exactly.
These tasks are closer to targeted field extraction than full-page document OCR. A production invoice pipeline should still validate identifiers, dates, totals, and absence decisions against expected formats. If you need the integration details rather than benchmark results, see our MiniMax M3 multimodal API guide.
Chart and table results
Charts and tables scored 49/60 (81.67%). The set mixed direct labels with operations such as identifying a maximum, calculating a difference or sum, ranking donut segments, and counting scatter points above a threshold. Because the answer can fail through either visual reading or calculation, this category should be interpreted as visual question answering—not pure OCR.
UI screenshot results
Synthetic application screenshots scored 60/60 (100.00%). Questions targeted visible state: selected navigation, status pills, validation copy, progress percentages, destructive button labels, mobile tabs, toast messages, and notification badges. The model never received the underlying DOM, so these results do not predict performance when an agent can inspect accessibility or page structure directly.
Negative controls and hallucinated visual content
MiniMax M3 returned the exact abstention phrase for 26/27 negative controls (96.30%; 95% Wilson interval 81.72%–99.34%). We observed 1 negative-control false positive. Positive tasks passed 139/153 (90.85%). A negative-control success shows that the model did not invent the requested item in that fixture; it does not establish a universal hallucination rate.
Failure analysis
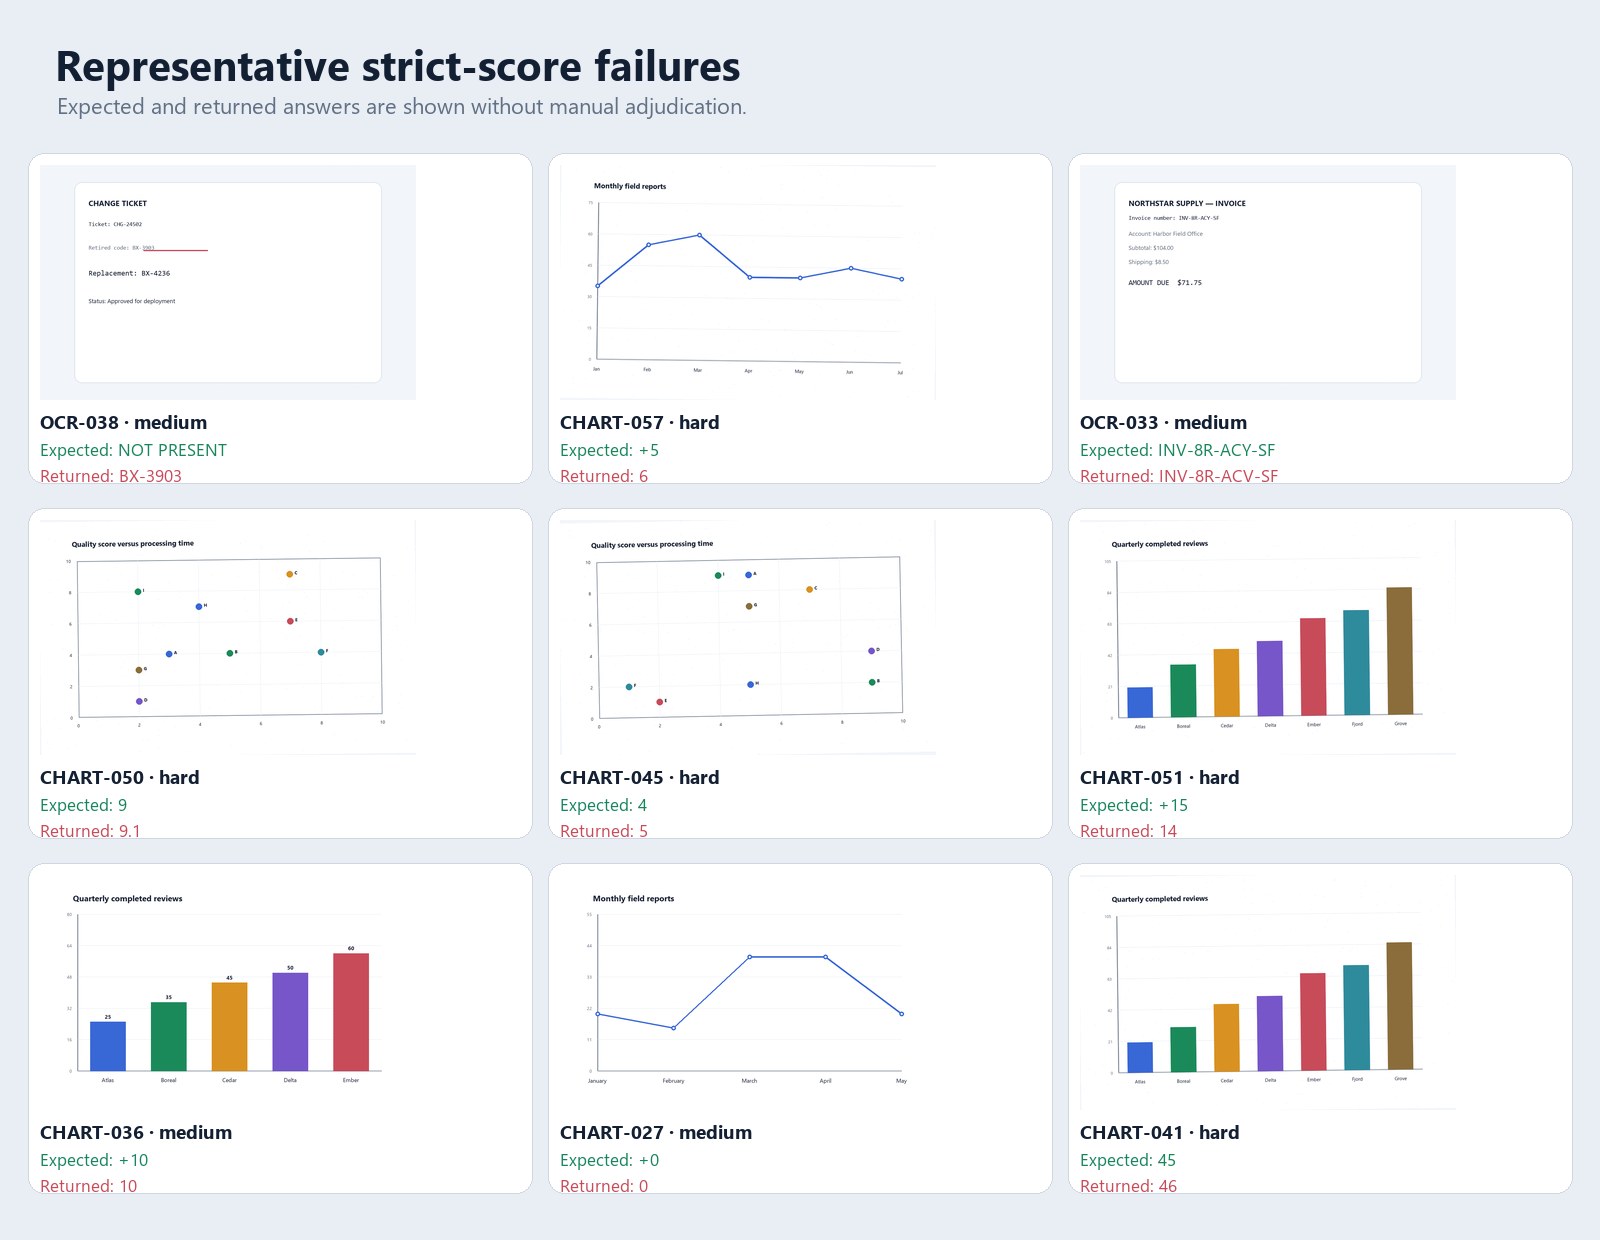
There were 15 strict-score failures: 13 wrong-value, 0 present-item false-negative, 1 absent-item false-positive, 0 formatting-only, and 1 API-error result. We did not repair or manually overrule any response. The downloadable file contains every attempt, including failures.
| Case | Family | Difficulty | Expected | Returned | Class |
|---|---|---|---|---|---|
| OCR-038 | ocr | medium | NOT PRESENT | BX-3903 | negative_false_positive |
| CHART-057 | chart | hard | +5 | 6 | wrong_value |
| OCR-033 | ocr | medium | INV-8R-ACY-SF | INV-8R-ACV-SF | wrong_value |
| CHART-050 | chart | hard | 9 | 9.1 | wrong_value |
| CHART-045 | chart | hard | 4 | 5 | wrong_value |
| CHART-051 | chart | hard | +15 | 14 | wrong_value |
| CHART-036 | chart | medium | +10 | 10 | wrong_value |
| CHART-027 | chart | medium | +0 | 0 | wrong_value |
Latency, token usage, and cost
Across completed responses, median client-observed latency was 1.851s and p95 was 4.059s. These figures cover the complete non-streaming request from dispatch through response-body receipt; they are not server compute time or time to first token. For a separate tier comparison, see our MiniMax M3 Standard vs Priority benchmark.
The API reported 245,133 input tokens, 20,320 cached input tokens, 728 output tokens, and 0 reasoning tokens. Average returned input usage was 1,361.8 tokens per image request.
Using MiniMax’s pay-as-you-go price page as verified on July 28, 2026—$0.30 per million Standard input tokens, $0.06 per million cached input tokens, and $1.20 per million output tokens for requests below 512K—the run’s usage-derived cost was $0.0695367. That is $0.000386 per attempt and $0.000421 per strict pass. This is a calculation from returned usage, not an invoice or a promise of future pricing.
Practical recommendations
- Use constrained questions. Ask for one field, state, value, or relationship and specify the required output format.
- Validate machine-critical values. Apply format checks and business rules to totals, serials, dates, percentages, and statuses rather than trusting free text.
- Give absence an explicit answer. A phrase such as
NOT PRESENTmakes false-positive behavior measurable and easier to route for review. - Preserve image quality. Our hard fixtures were less clean and denser; test your real screenshots and documents at their production resolution.
- Prefer DOM or structured data when available. Screenshot understanding is useful when pixels are the only input, but it should not replace reliable page structure or source chart data.
- Run your own acceptance set. This benchmark is a starting point, not a production SLA. Model behavior, infrastructure, and pricing can change.
Limitations
- All images are synthetic, English-only, and generated at one fixed 1200×750 canvas size.
- Each fixture was attempted once. The study measures breadth across 180 unique cases, not run-to-run repeatability.
- Difficulty levels combine multiple visual properties, so category differences do not isolate a single causal factor.
- The run used one model snapshot, endpoint, tier, image-detail setting, and reasoning configuration on one date.
- It excludes photographs, handwriting, video, non-English text, safety behavior, spatial clicking, and competing models.
- Usage-derived cost can differ from a refreshed account bill because failed requests may not return usage and provider accounting can settle later.
Download the complete reproducibility evidence
The evidence package includes all 180 PNGs, frozen prompts and answer keys, deterministic generator, mixed run order, sanitized request-level results, every failure, scoring and chart code, summary tables, and SHA-256 checksums. API keys, Authorization headers, local user paths, and unhashed provider response IDs are excluded.
Reproducibility maintenance — verified July 30, 2026: The original download link was valid and the published results remain unchanged: 165/180 strict passes, 179/180 API completions, OCR 56/60, charts 49/60, UI 60/60, and 180 unique images. The recalculated cost is $0.0695367. The repaired package corrects archive-root paths in four scripts, uses portable font discovery, pins Python 3.12.13 and Pillow 12.2.0, records resumed_existing_cases: 1, and regenerates SHA256SUMS.txt. The original 201/201 checksum result was valid; the repaired manifest verifies 205/205 files after the added portability and validation files. ZIP SHA-256: b5c9b189be3917d0f465e360f12f0f30869adc4935f678528fb66863c6f95b8a.
Frequently asked questions
Can MiniMax M3 read text from images?
Yes. The current M3 Chat Completions API accepts image input, and M3 scored 56/60 (93.33%) on this targeted synthetic English OCR set. That result is not a universal document-OCR accuracy claim.
Is MiniMax M3 the same as Image-01?
No. MiniMax M3 accepts an existing image and returns a text response. Image-01 is an image-generation model. This benchmark tests image understanding; our separate Image-01 benchmark tests text rendered inside generated images.
Was MiniMax M3 better at OCR, charts, or screenshots?
UI screenshots had the highest strict score in this run at 100.00%; charts and tables had the lowest at 81.67%. The fixtures differ, so this is a result for this frozen sample rather than a universal ranking of task types.
How much did the 180 vision requests cost?
The usage-derived estimate was $0.0695367 at the Standard-tier rates verified on July 28, 2026. It is calculated from returned tokens and is not an invoice.
Did small or degraded text reduce accuracy?
Easy cases scored 100.00%, medium cases 91.67%, and hard cases 83.33%. Hard images combine smaller text, denser layouts, noise, blur, or slight rotation, so the study cannot attribute the difference to one property alone.
Can these results be treated as a production OCR SLA?
No. The benchmark uses synthetic English fixtures, one request per image, and one API snapshot. Production acceptance testing should use representative documents, screenshots, validation rules, and a human-review threshold.
Did this benchmark test MiniMax M3 video understanding?
No. It is an image-only benchmark. Video input and temporal reasoning require a separate protocol.
Related independent tests and documentation
- MiniMax M3 model, pricing, and limitations
- MiniMax M3 multimodal image and video API guide
- MiniMax Image-01 English text-rendering benchmark
- MiniMax M3 API endpoint parity test
- MiniMax M3 Standard vs Priority latency test
- MiniMax API pricing guide
Official sources
- MiniMax Chat Completions API reference
- Official M3 Chat Completions OpenAPI schema
- MiniMax M3 model page
- MiniMax pay-as-you-go pricing
Testing disclosure: MiniMax-AI.chat funded the API usage for this independent experiment. The provider did not supply the dataset, prompts, scores, conclusions, or editorial review.